How to Analyze QR Code Performance with CrabQR Analytics
Track and analyze QR code performance with CrabQR's comprehensive analytics dashboard. View scan statistics, geographic data, device types, and time-series trends to optimize your campaigns.
- Open Analytics Dashboard
- View Overall Statistics
- Explore Time Series Charts
- Check Geographic Distribution
- View Individual QR Analytics
Open Analytics Dashboard
In the CrabQR sidebar, click on Analytics from the main
navigation menu. The analytics dashboard loads with comprehensive data about
all your QR codes' performance. CrabQR automatically tracks every scan with
detailed information including timestamp, location, device type, and more. You
can access analytics anytime to monitor your QR codes' effectiveness and make
data-driven decisions.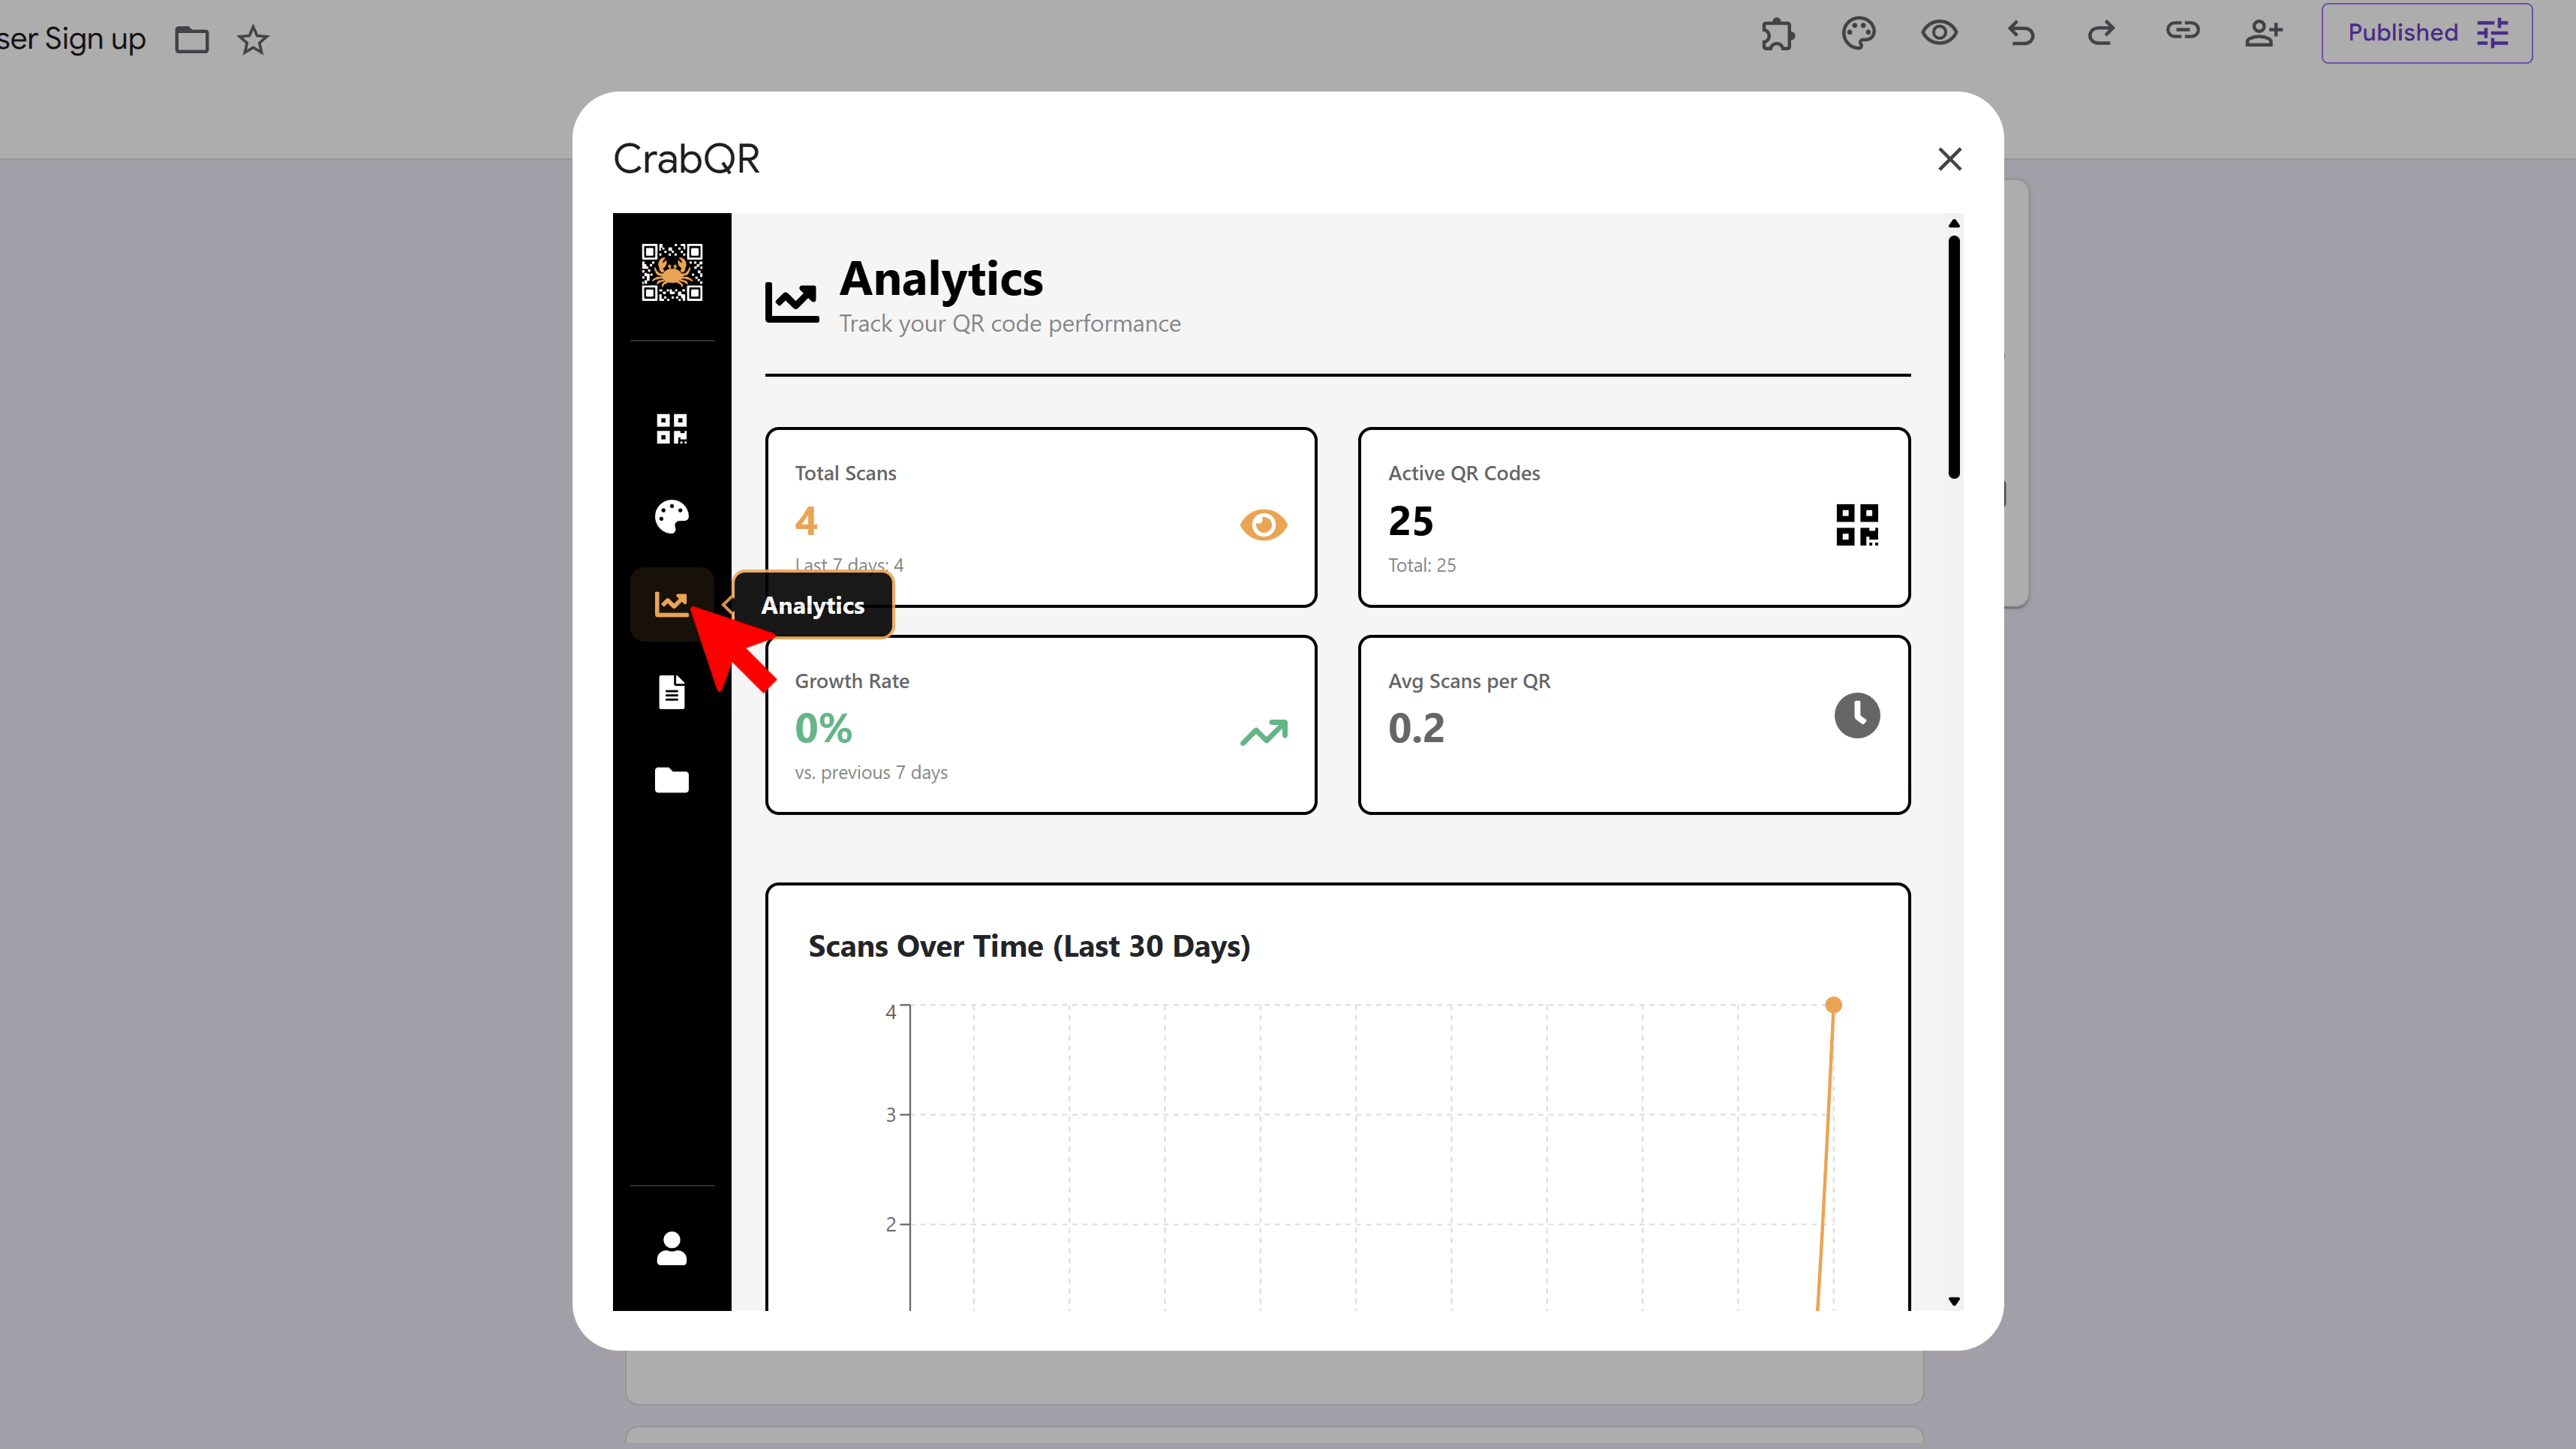
View Overall Statistics
At the top of the analytics dashboard, you'll see key summary metrics
displayed in prominent cards: Total Scans (across all your QR
codes), Active QR Codes (currently functioning codes),
Growth Rate (percentage change compared to the previous 7-day
period), and Average Scans per QR Code. These metrics give
you an instant overview of your QR code program's performance. Watch the
growth rate to see if your campaigns are gaining traction.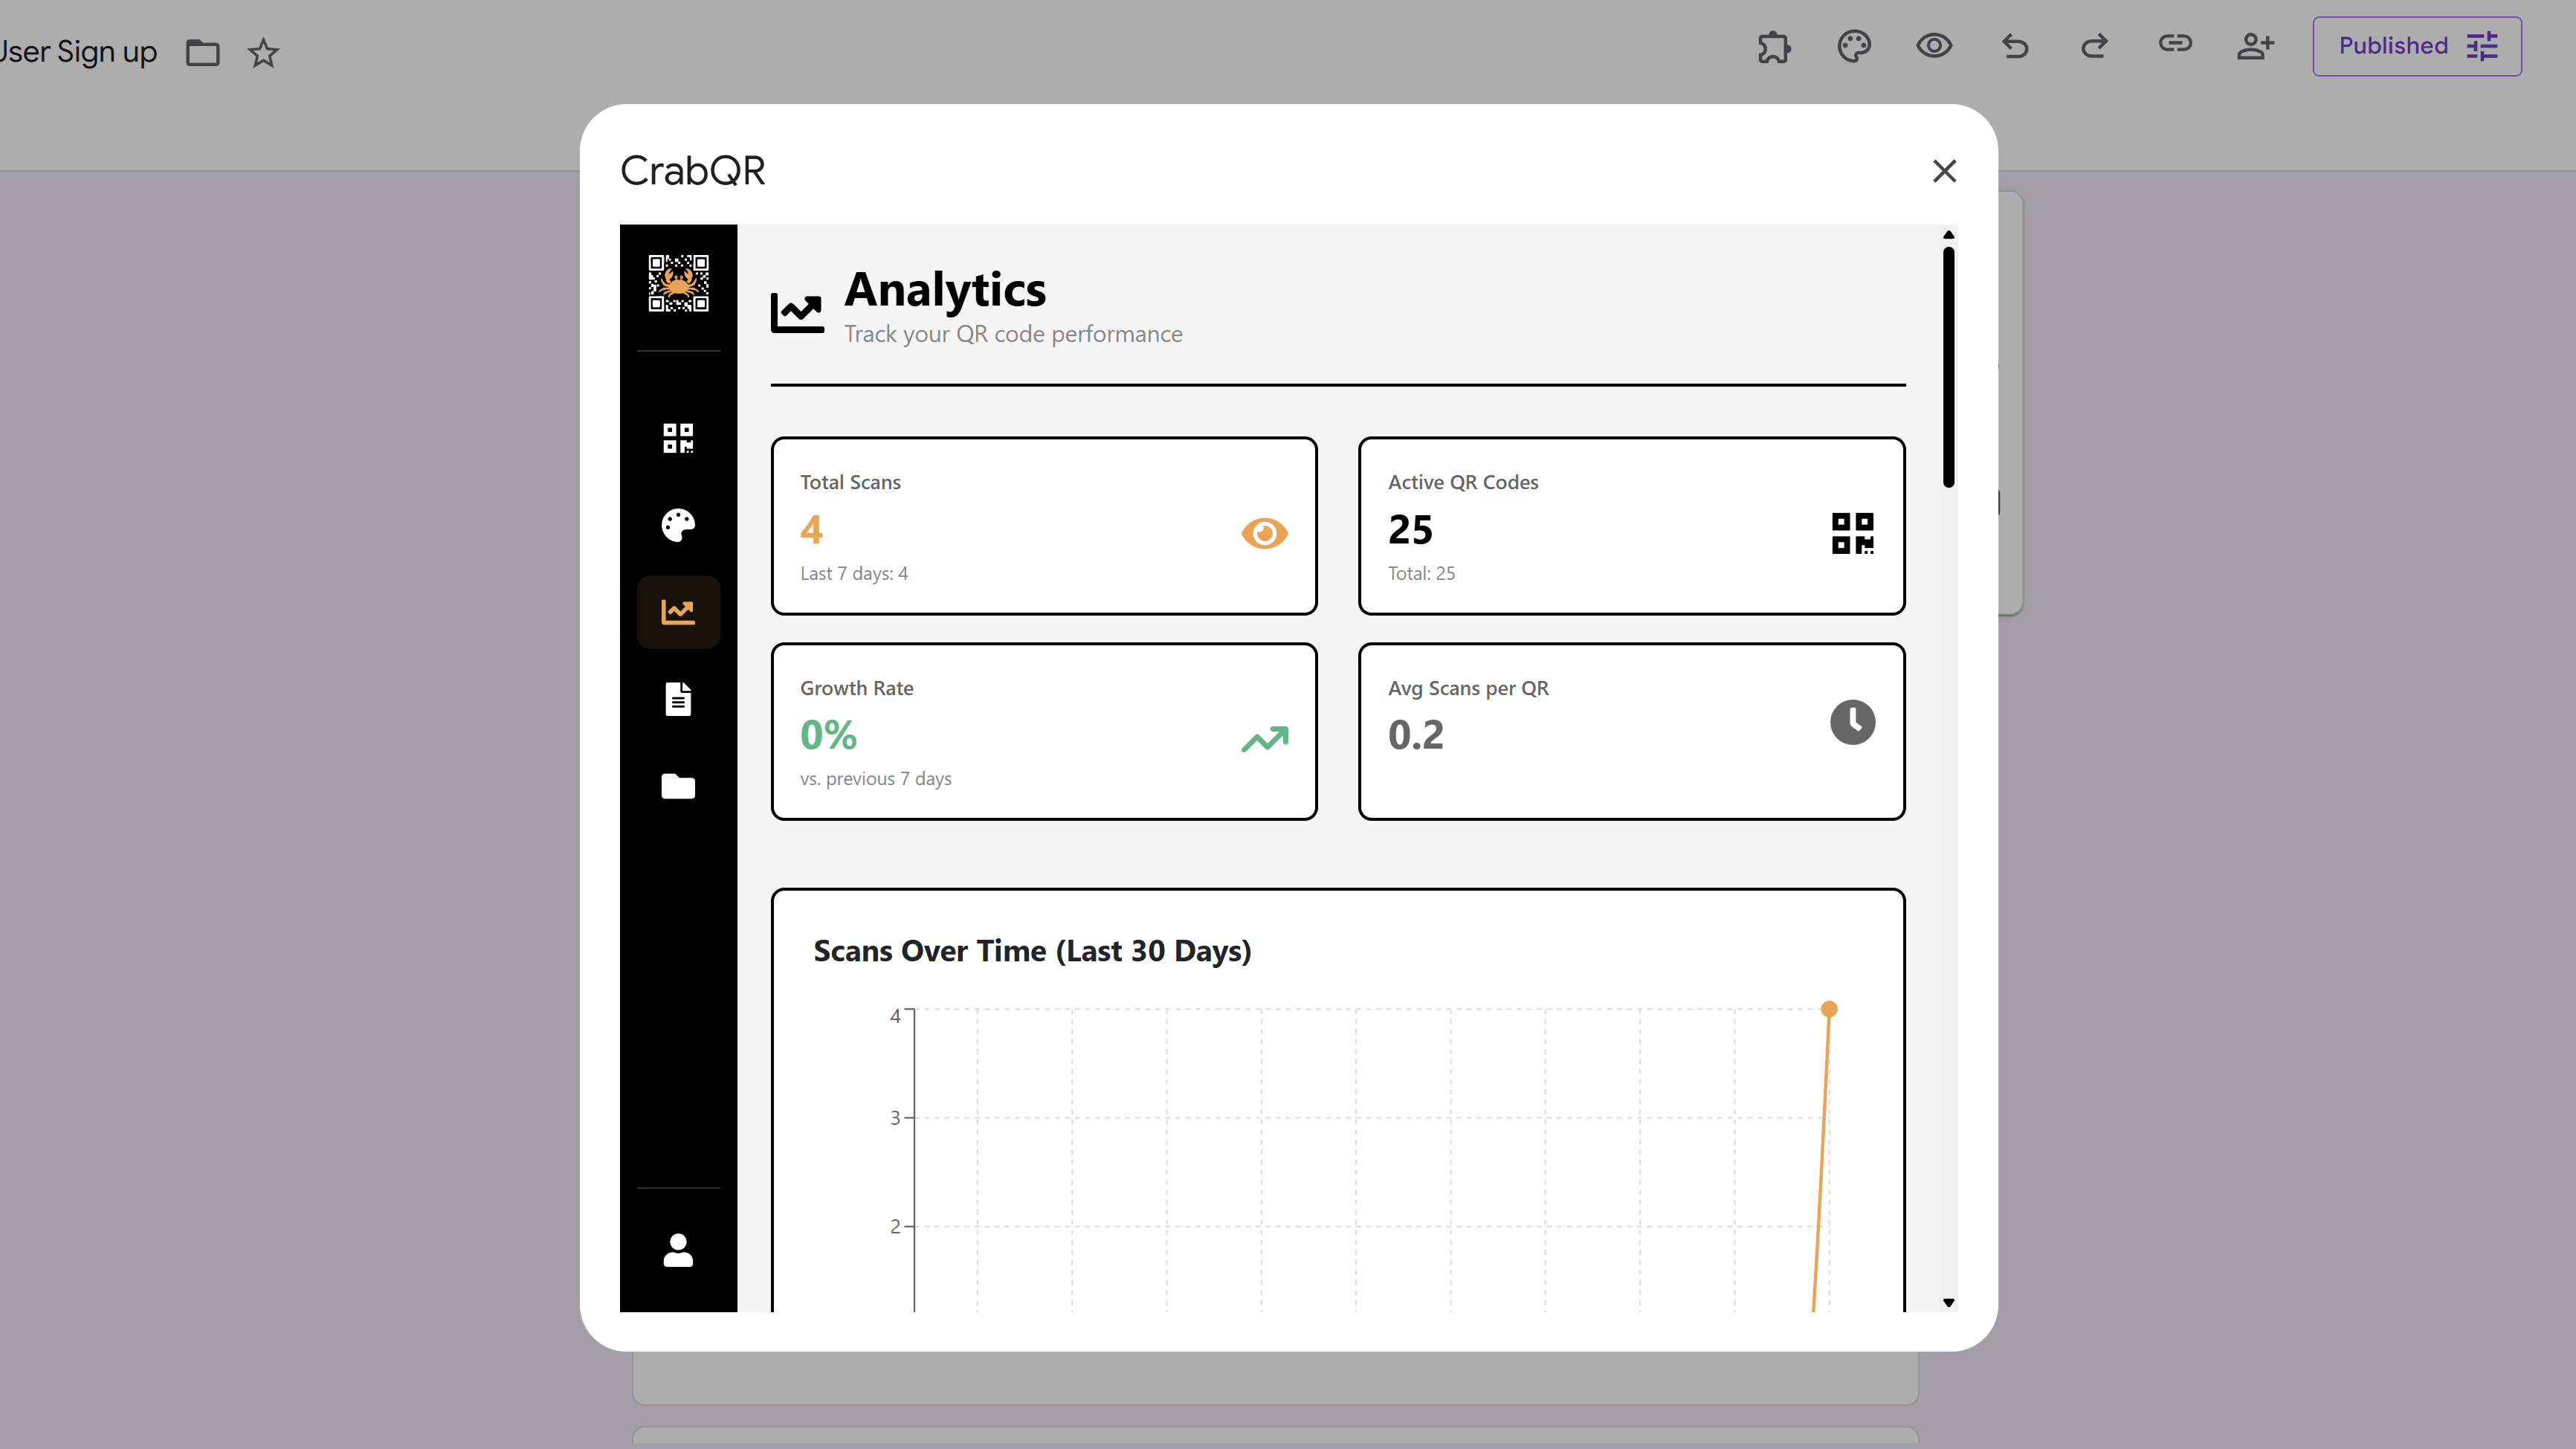
Explore Time Series Charts
Scroll down to see three time-based visualizations. The
30-Day Trend line chart shows daily scan volume over the past
month, helping you identify patterns and peak days. The
Hourly Heatmap displays which hours of the day (0-23) receive
the most scans, revealing optimal times for QR code engagement. The
Weekly Pattern bar chart shows scan distribution across days
of the week (Monday through Sunday), helping you understand weekly usage
patterns.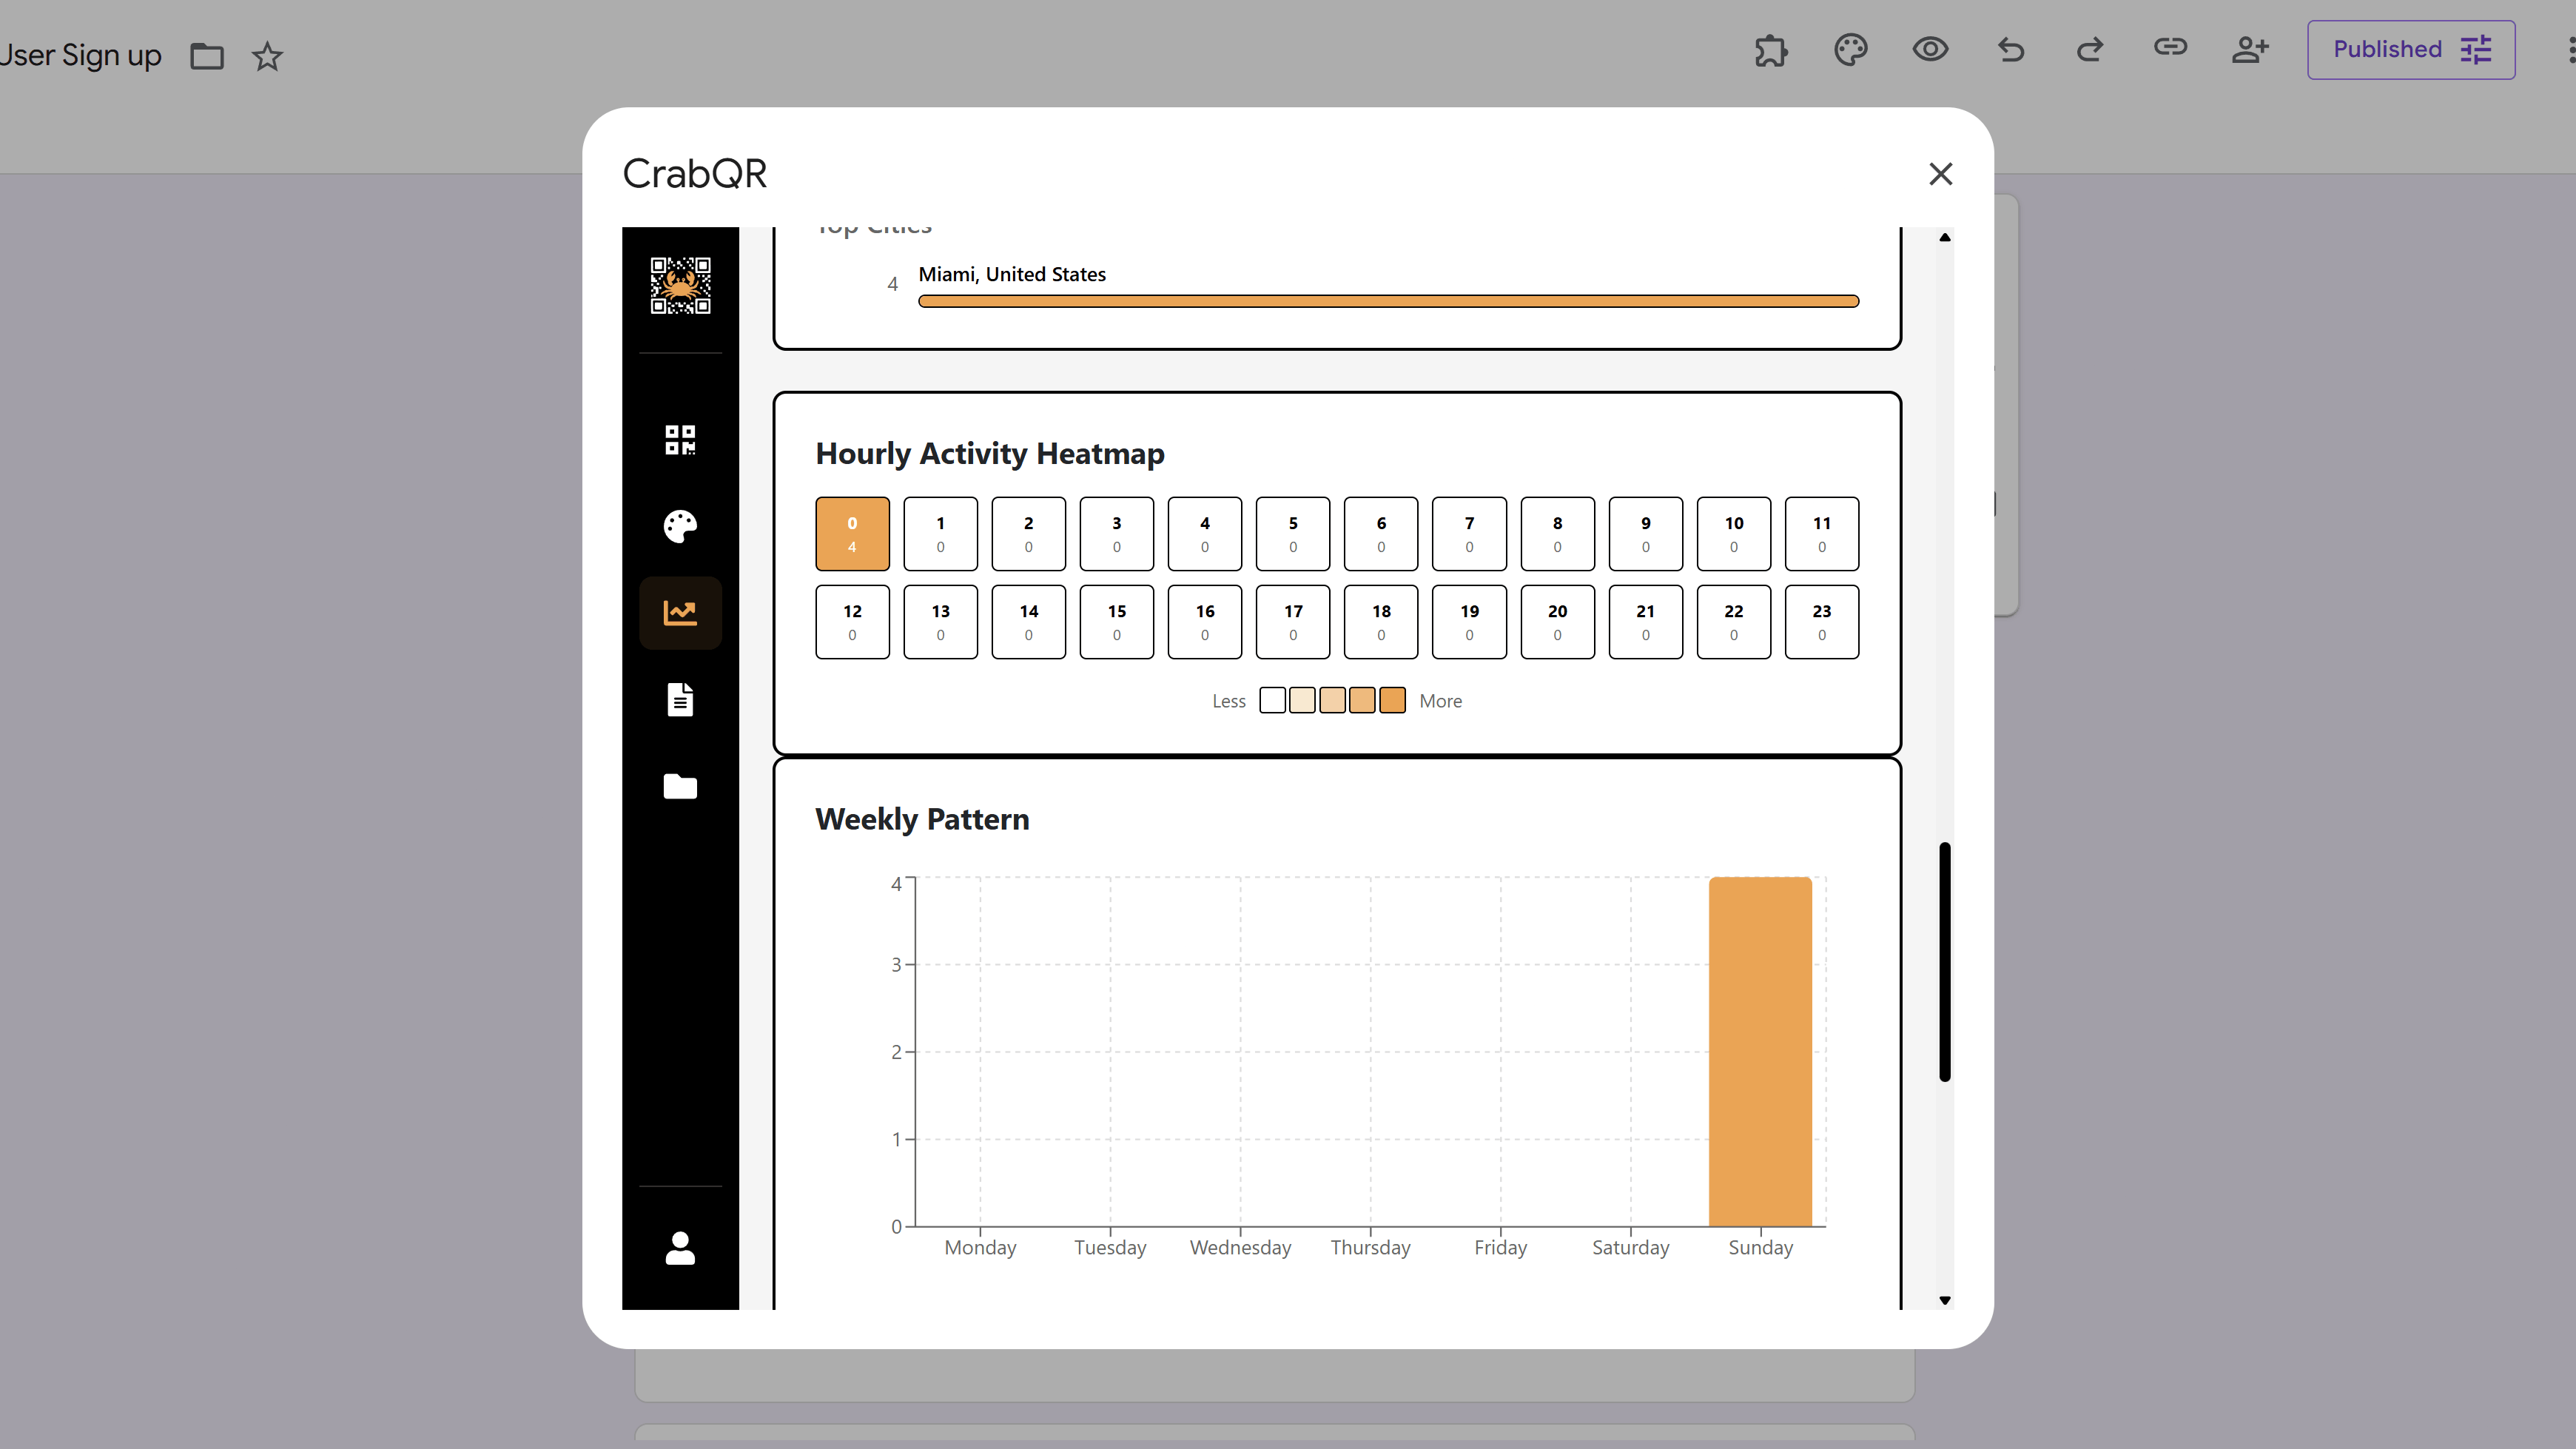
Check Geographic Distribution
The geographic section shows where your QR codes are being scanned. The
Country Breakdown horizontal bar chart displays the top 10
countries with exact scan counts and percentages. Below that, the
City Breakdown shows the top cities with progress bars
indicating relative scan volume. This geographic data helps you understand
your audience's location and can inform targeted marketing decisions or
localization strategies.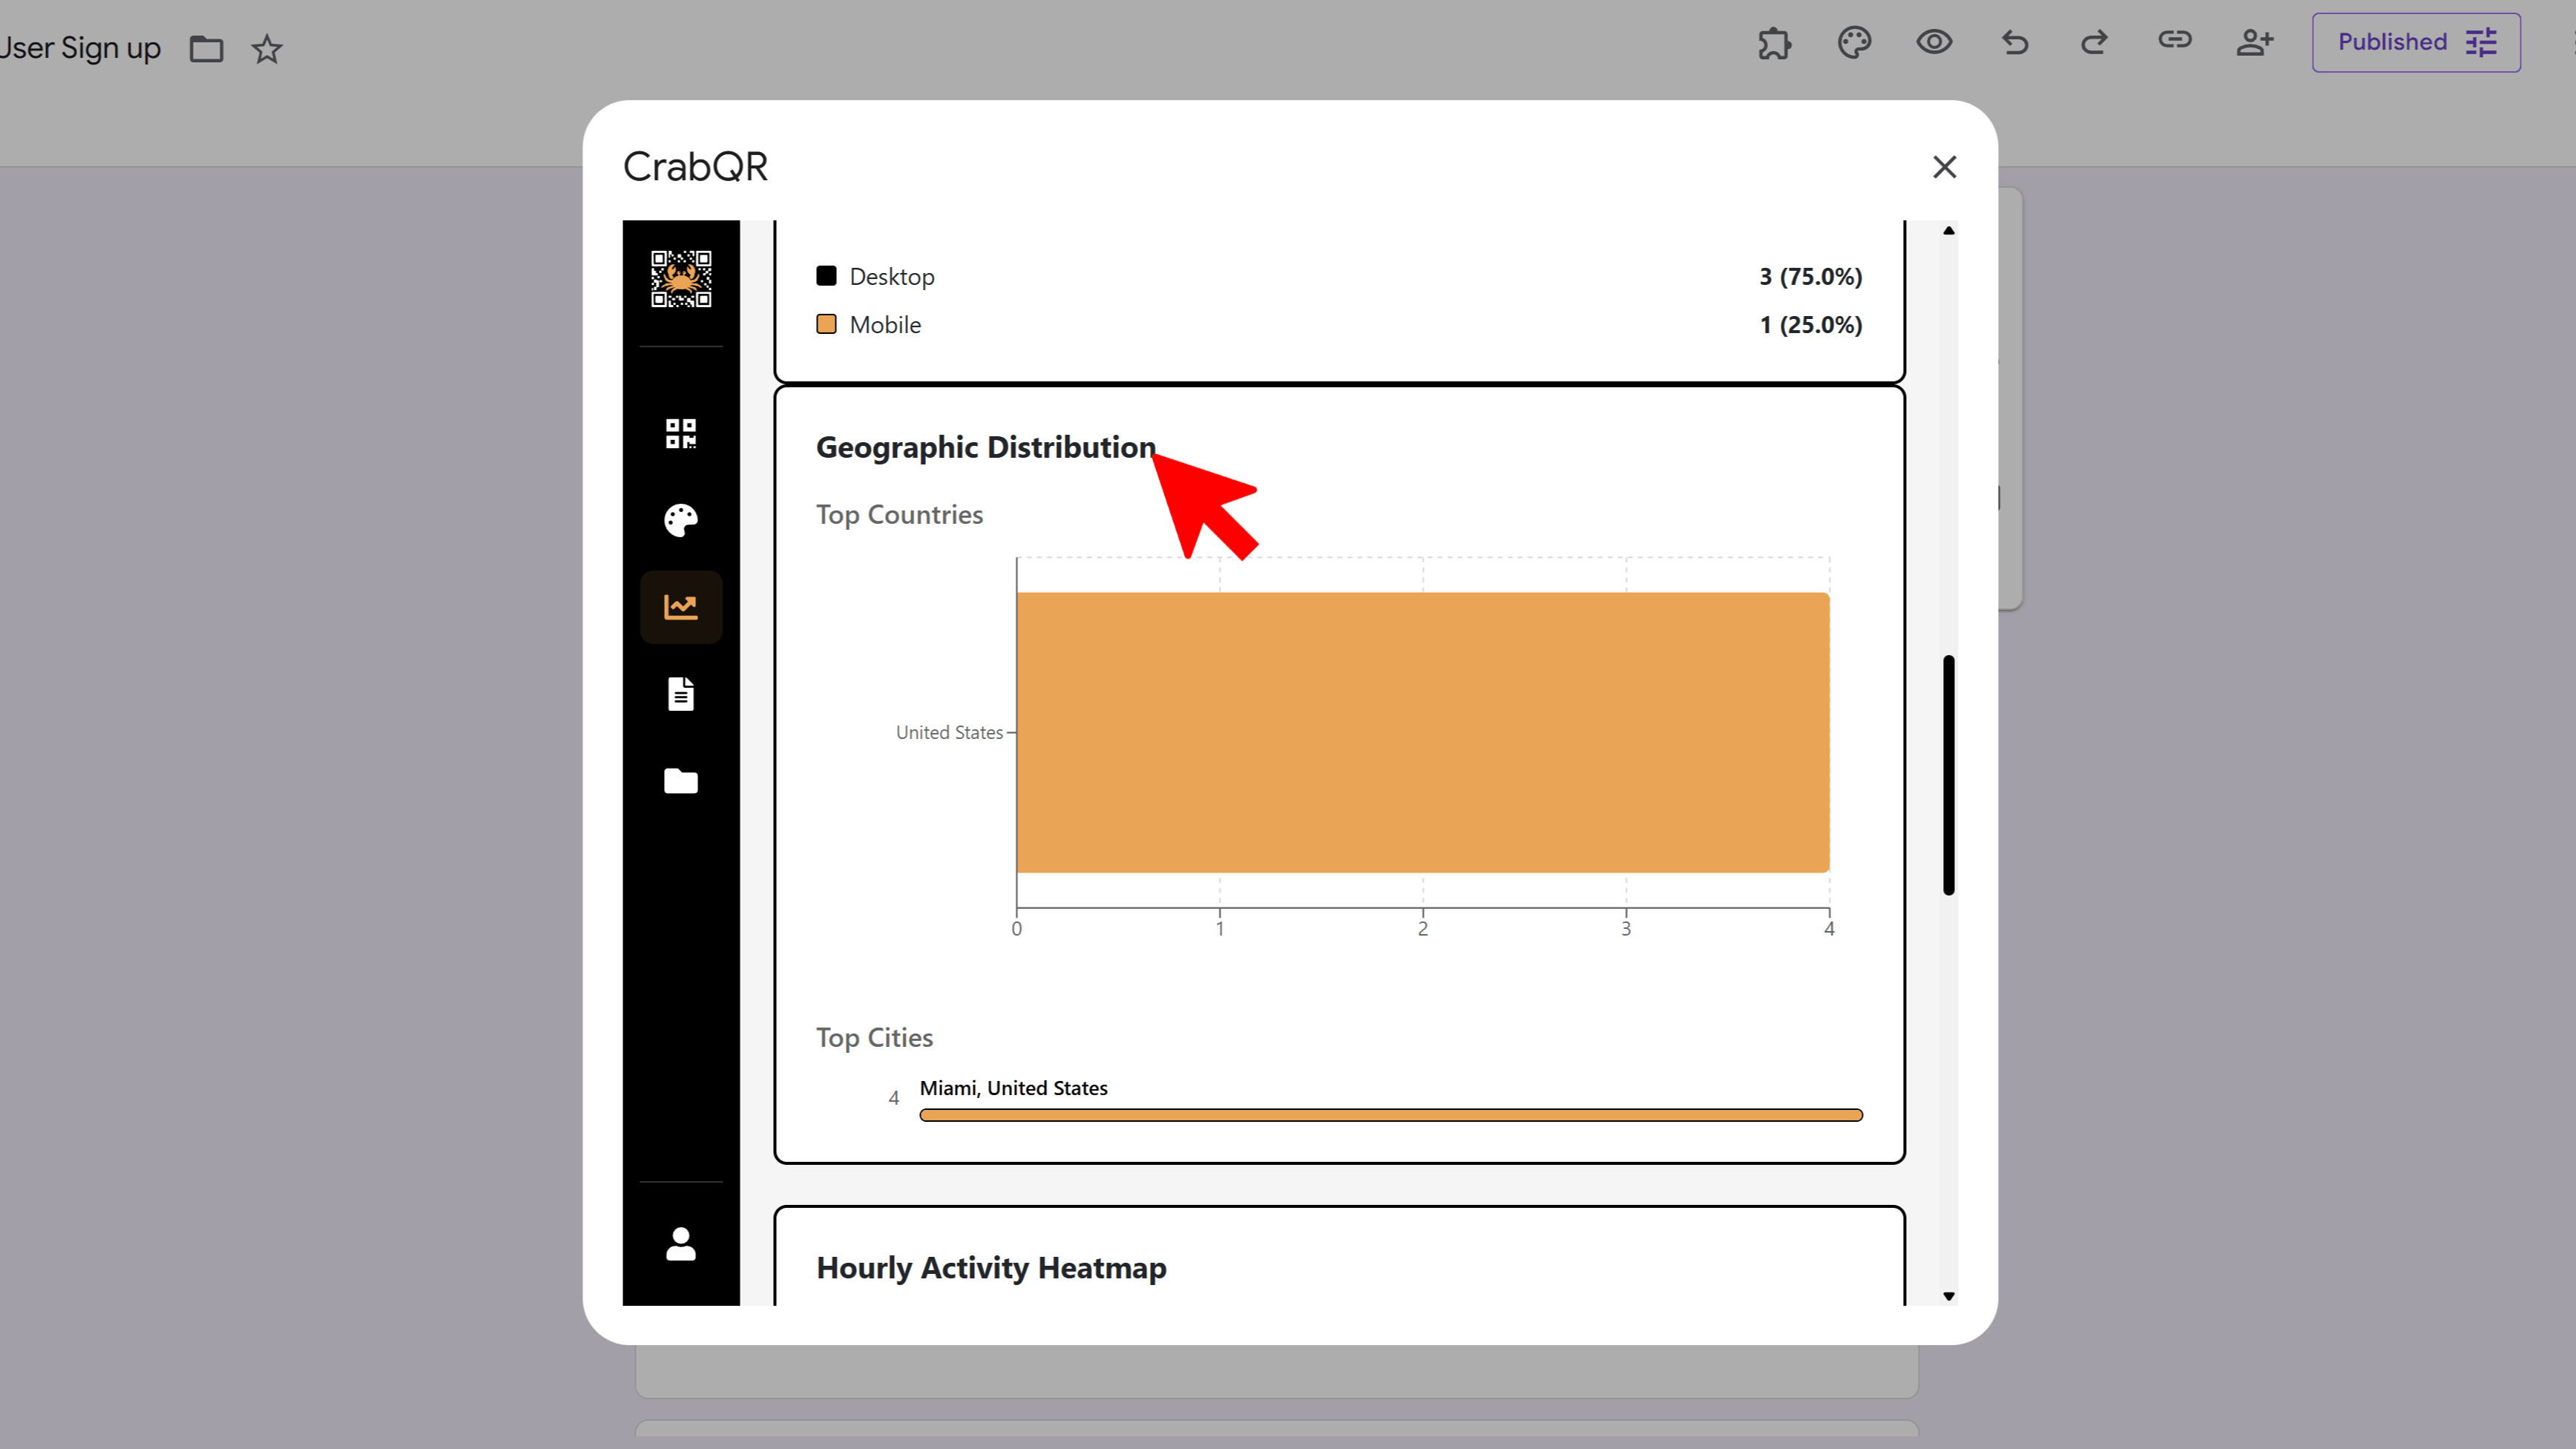
View Individual QR Analytics
To see detailed analytics for a specific QR code, either click a bar in the
Top Performers chart at the bottom of the dashboard, or go to
the Management section and click the analytics icon on any QR code card. The
individual analytics page shows the same chart types but filtered to just that
one QR code. Additionally, you'll see a Recent Scans table
with the last 20 scan events, including timestamp ("2 hours ago"), location
(city, country), device type, IP address, and user agent. This granular data
helps you understand exactly who is scanning your QR codes and when.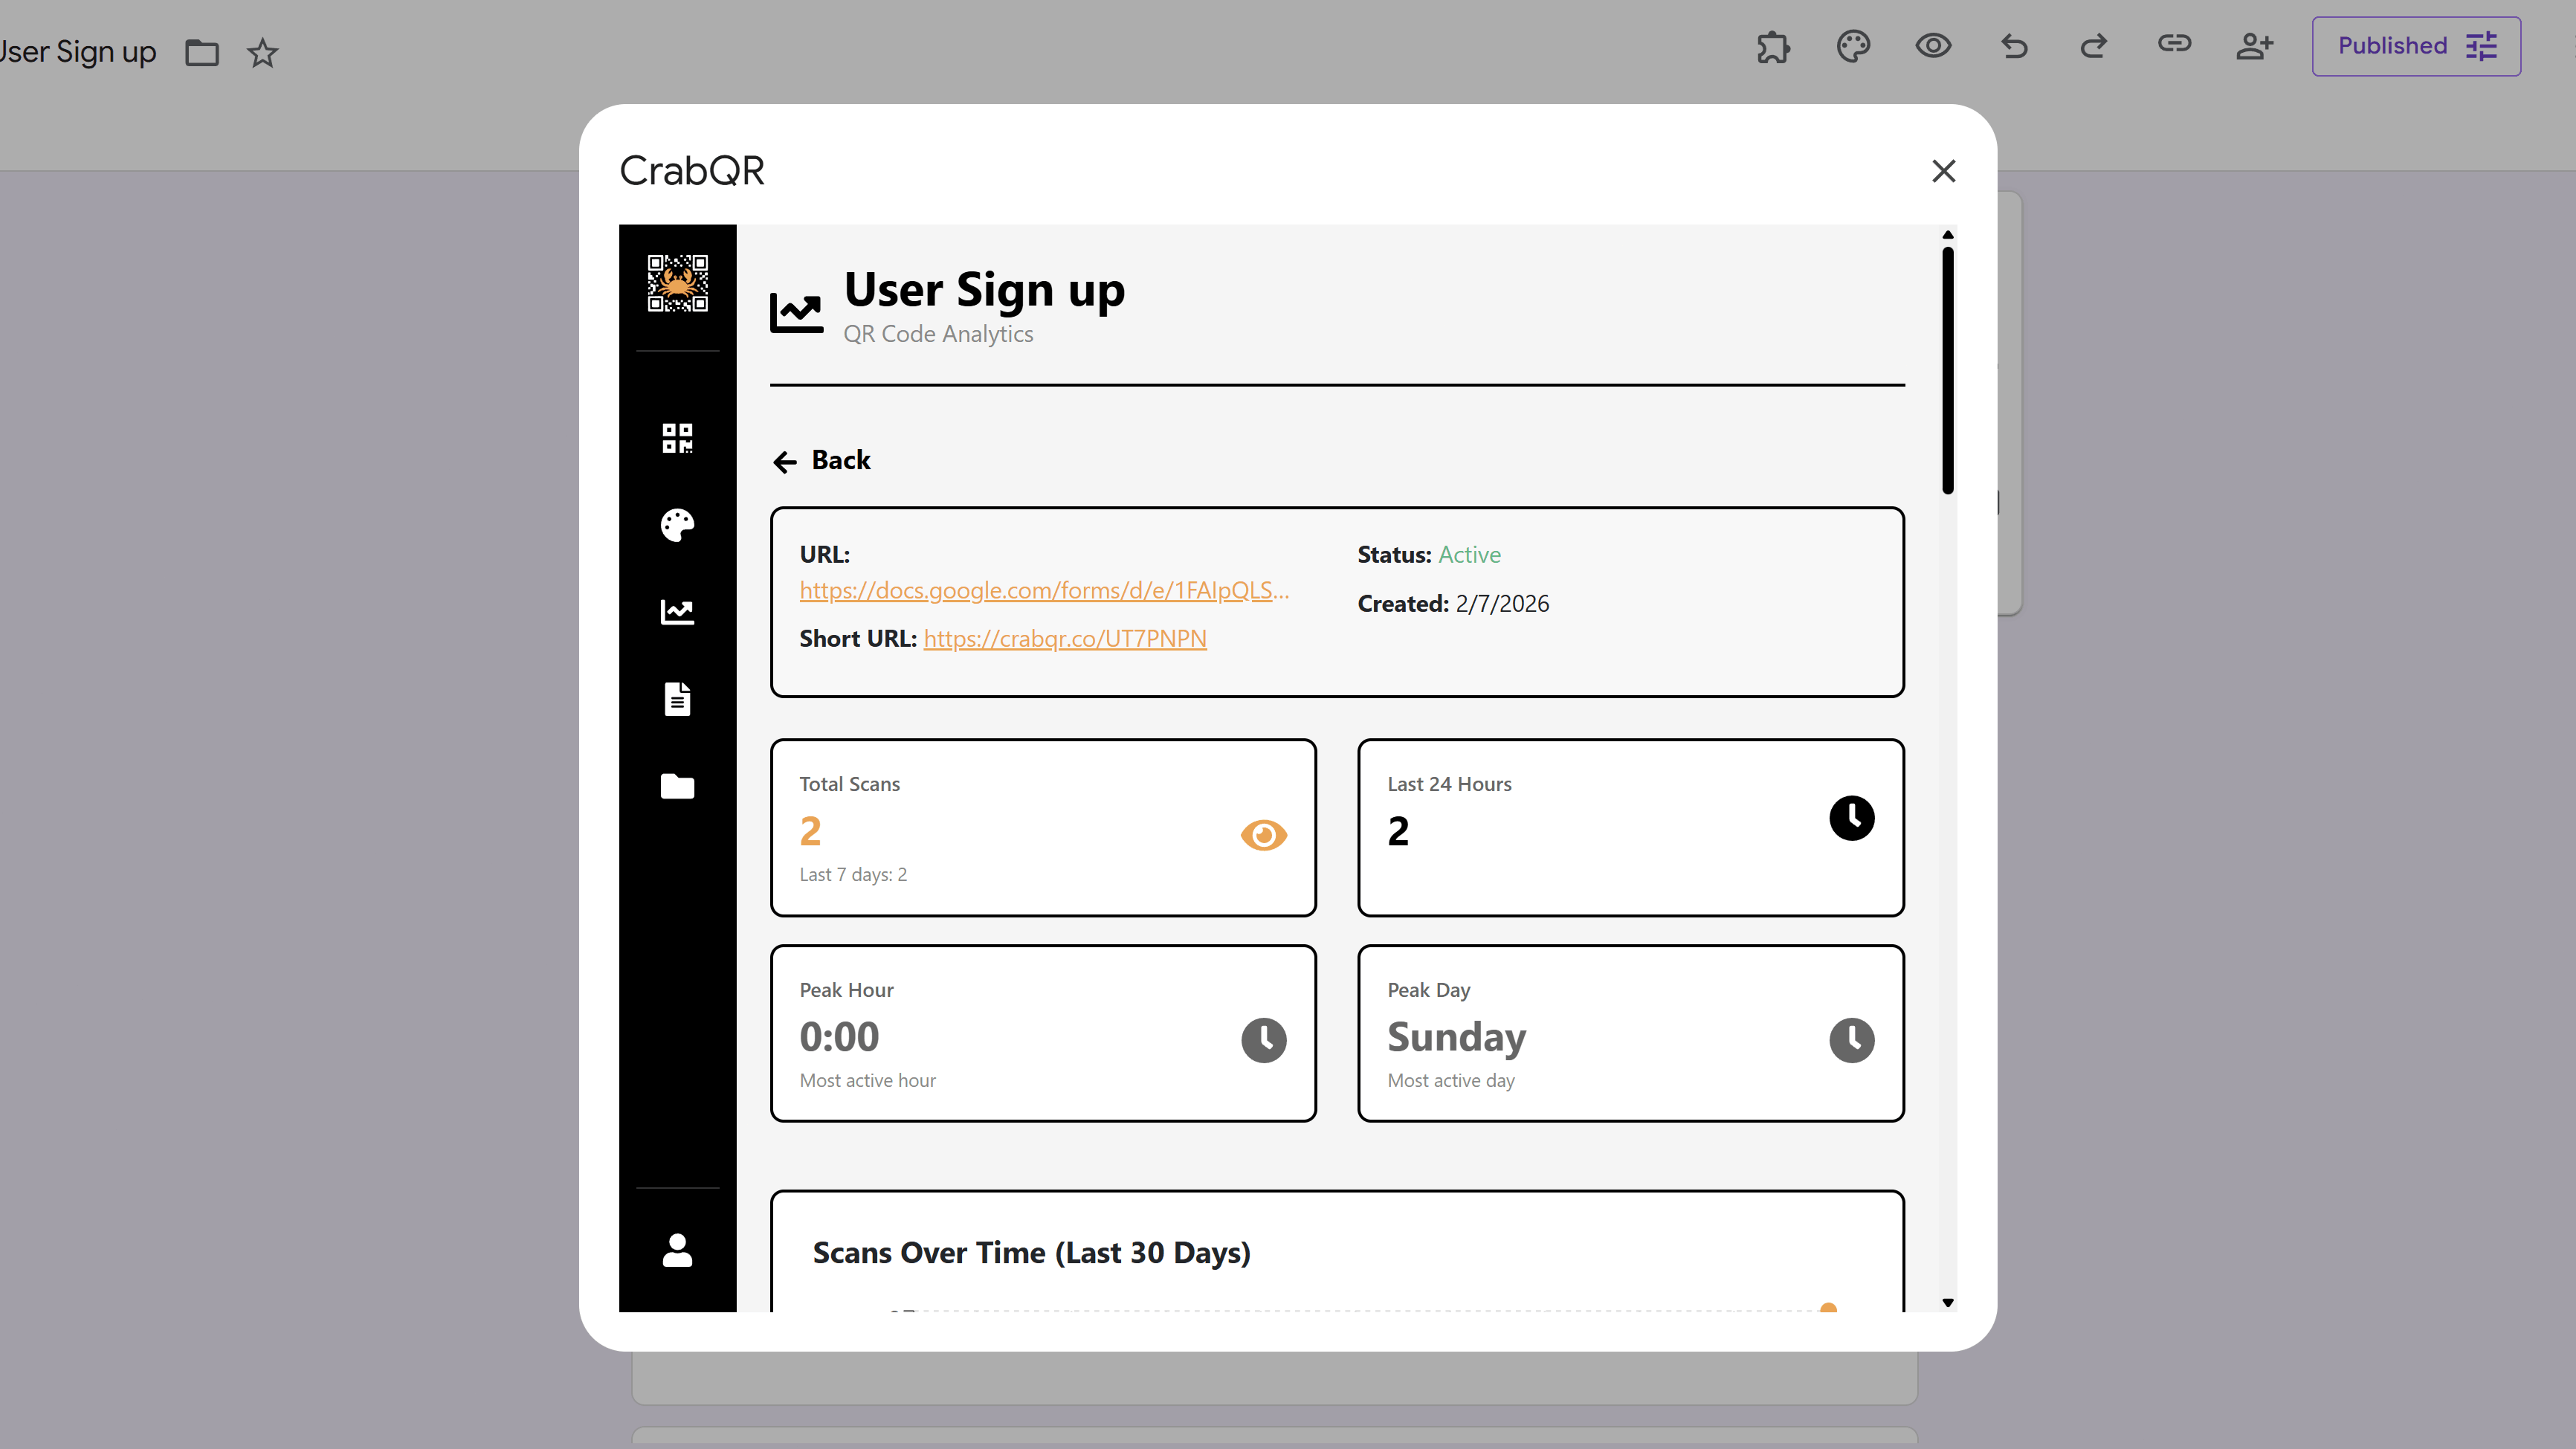
Tips and Best Practices
- Check analytics regularly (weekly or monthly) to identify trends and optimize your QR code strategy.
- Use the hourly heatmap to schedule social media posts or email campaigns during peak engagement hours.
- Compare geographic data with your target audience to see if your QR codes are reaching the right locations.
- Monitor device type distribution - if most scans are mobile, ensure your landing pages are mobile-optimized.
- Use individual QR analytics to identify your best-performing codes and replicate their success in future campaigns.
Common Pitfalls to Avoid
- Don't focus solely on total scans - also look at growth rate and per-code averages for better insights.
- Avoid making decisions based on very short time periods - look at trends over weeks or months.
- Remember that scan events are stored for 90 days (TTL) - export important data regularly if you need longer retention.
- Don't ignore low-performing QR codes - investigate whether they need better placement, updated content, or retirement.
CrabQR: QR Code Generator & Analytics
Create, customize, and track QR codes with advanced styling, landing pages, and comprehensive analytics. Perfect for marketing and event management.
- Dynamic QR code generation
- Advanced styling & customization
- Custom landing pages
- Real-time scan analytics
- Bulk QR code creation
- Built right into Google Workspace